
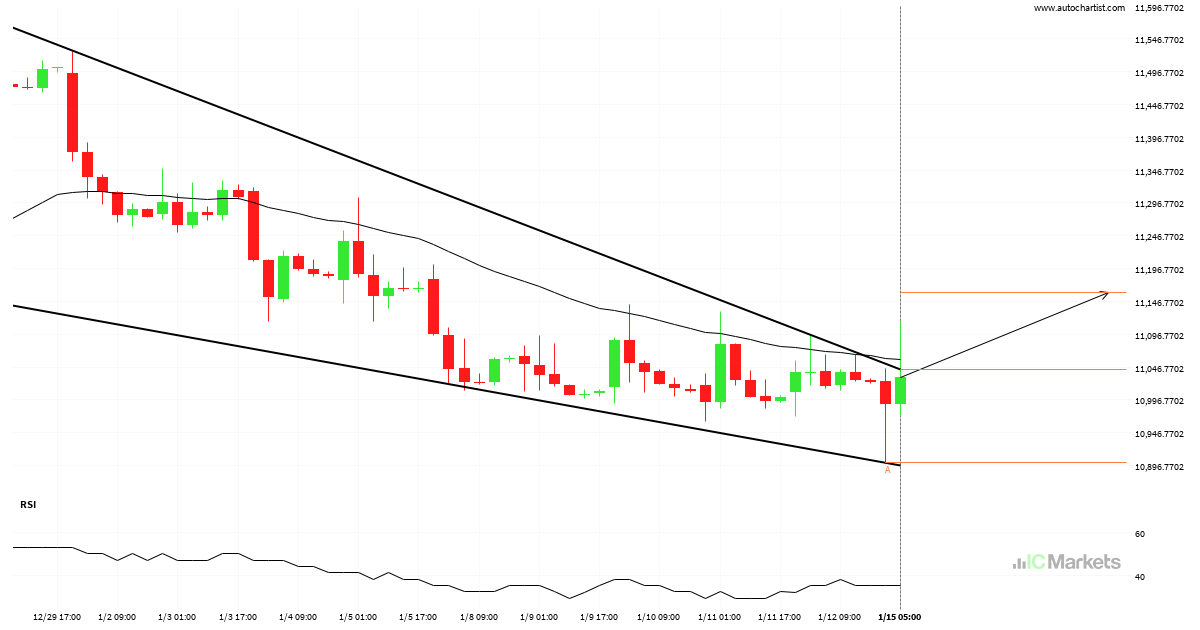
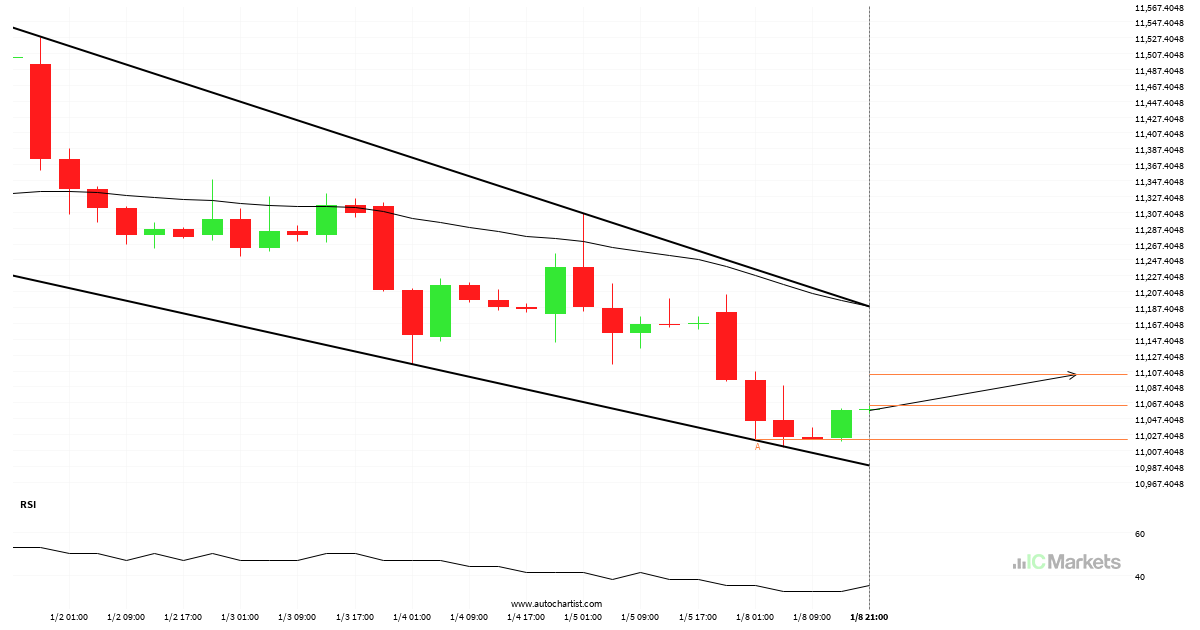
A possible start of a bullish trend on FTSE China A50 Index
FTSE China A50 Index has broken through a resistance line of a Falling Wedge chart pattern. If this breakout holds true, we may see the price of FTSE China A50 Index testing 11159.9520 within the next 3 days. But don’t be so quick to trade, it has tested this line in the past, so you […]
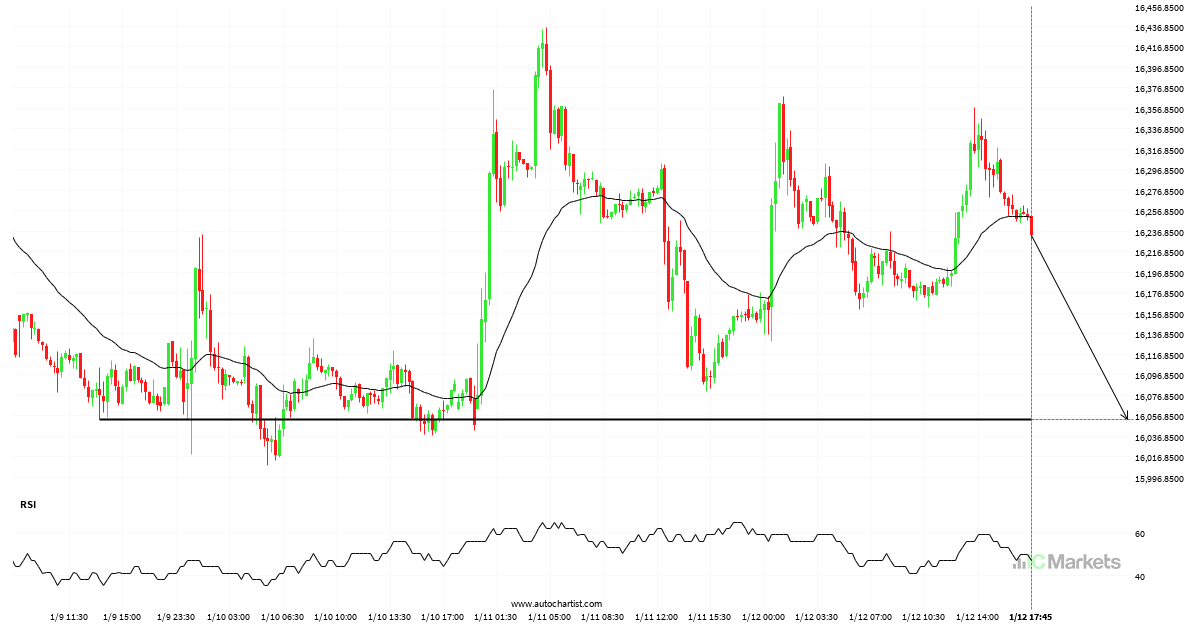
Hong Kong 50 Index – getting close to psychological price line
Hong Kong 50 Index is moving towards a key support level at 16053.5000. This is a previously tested level for Hong Kong 50 Index. This could be a good trading opportunity, either at the spot price, or after breaching this level.
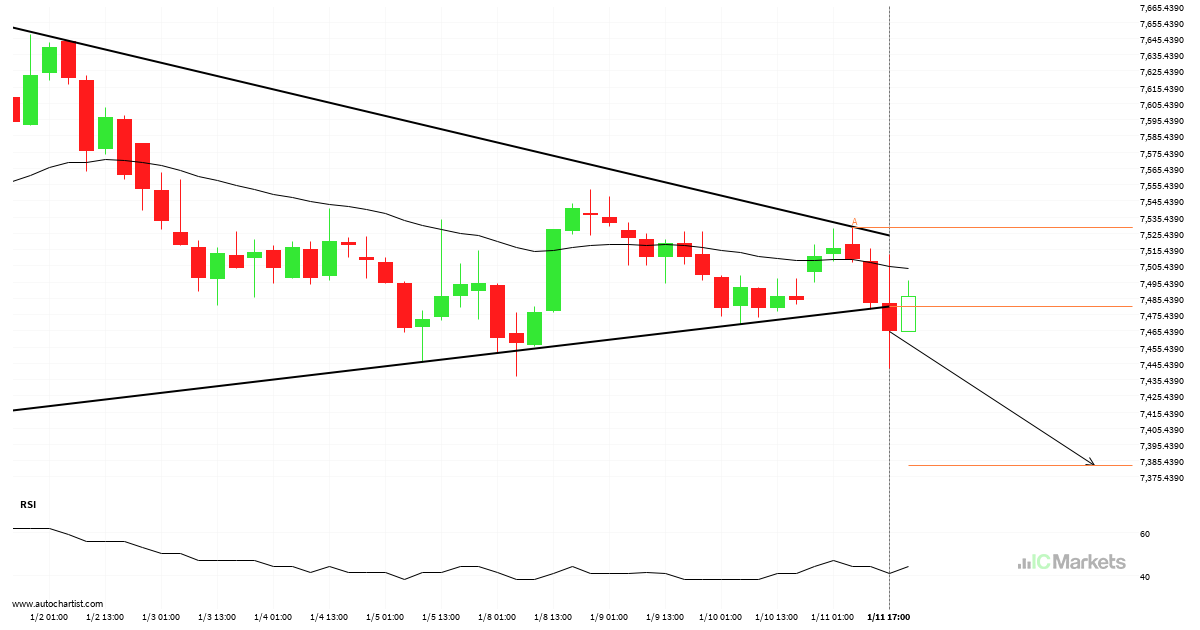
Triangle breakout on Australia 200 Index
This trade steup on Australia 200 Index is formed by a period of consolidation; a period in which the price primarily moves sideways before choosing a new direction for the longer term. Because of the bearish breakout through support, it seems to suggest that we could see the next price move to 7382.7395.
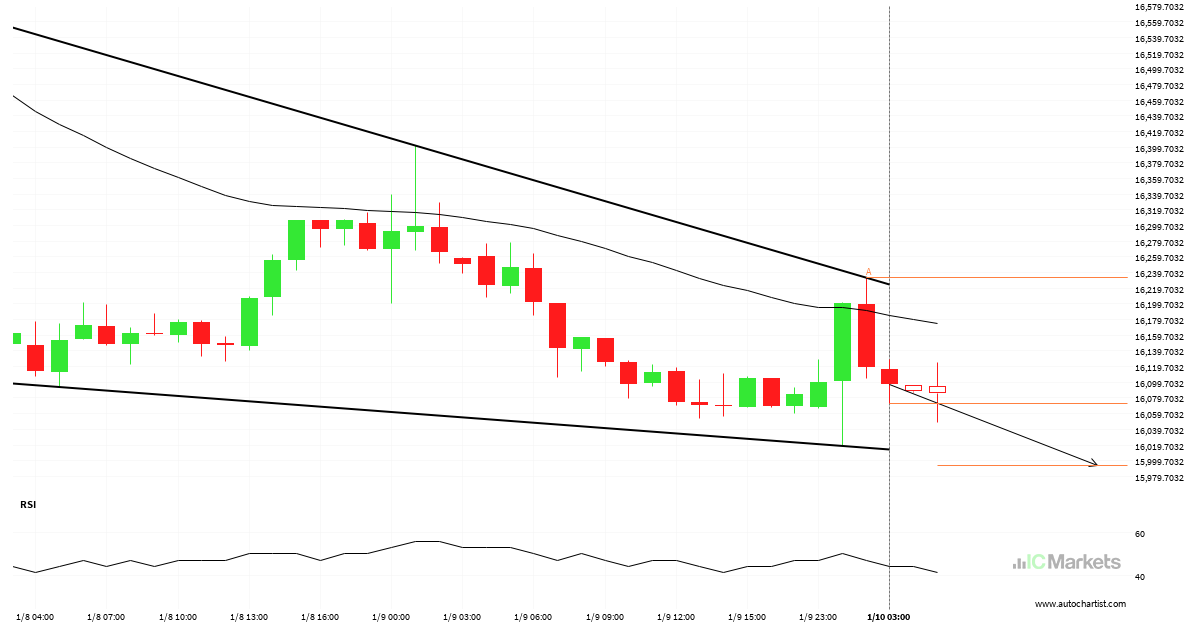
Hong Kong 50 Index approaching support of a Falling Wedge
Hong Kong 50 Index is heading towards the support line of a Falling Wedge and could reach this point within the next 9 hours. It has tested this line numerous times in the past, and this time could be no different from the past, ending in a rebound instead of a breakout. If the breakout […]
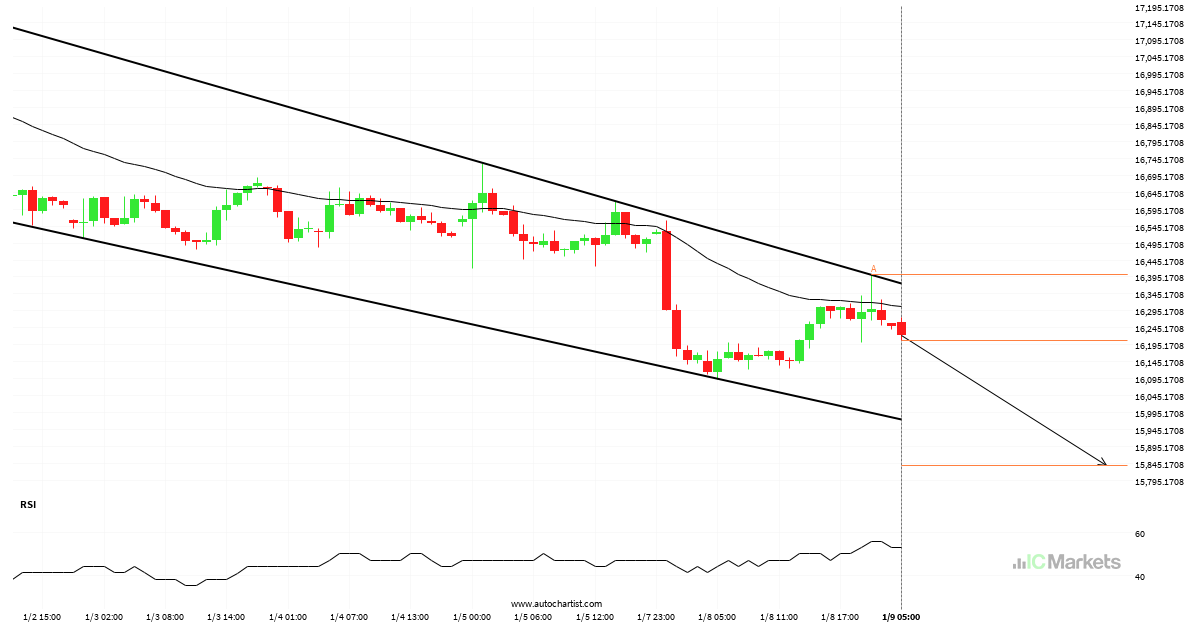
Hong Kong 50 Index approaching support of a Channel Down
Hong Kong 50 Index was identified at around 16207.5 having recently rebounded of the resistance on the 1 hour data interval. Ultimately, the price action of the stock has formed a Channel Down pattern. This squeeze may increases the chances of a strong breakout. The projected movement will potentially take the price to around the […]
Will FTSE China A50 Index have enough momentum to break resistance?
An emerging Flag has been detected on FTSE China A50 Index on the 4 hour chart. There is a possible move towards 11103.4236 next few candles. Once reaching support it may continue its bullish run or reverse back to current price levels.

Continuation pattern on Hong Kong 50 Index
Hong Kong 50 Index has broken through a support line of a Triangle chart pattern. If this breakout holds true, we may see the price of Hong Kong 50 Index testing 16086.5284 within the next 3 days. But don’t be so quick to trade, it has tested this line in the past, so you should […]
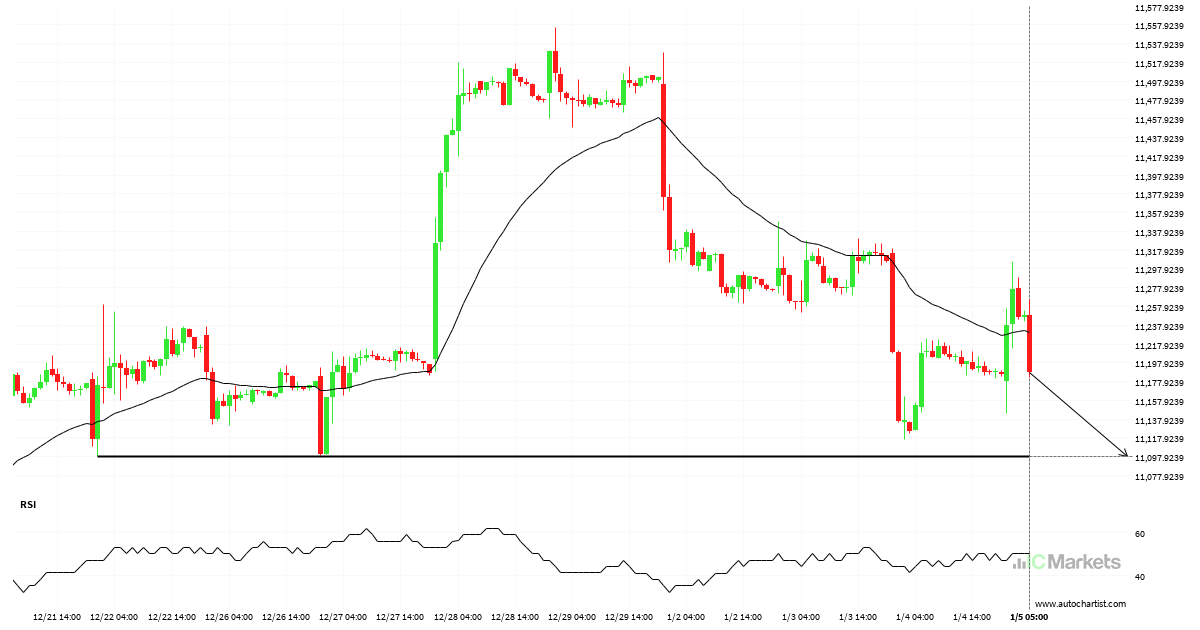
Breach of important price line imminent by FTSE China A50 Index
FTSE China A50 Index is moving towards a key support level at 11098.2803. This is a previously tested level for FTSE China A50 Index. This could be a good trading opportunity, either at the spot price, or after breaching this level.
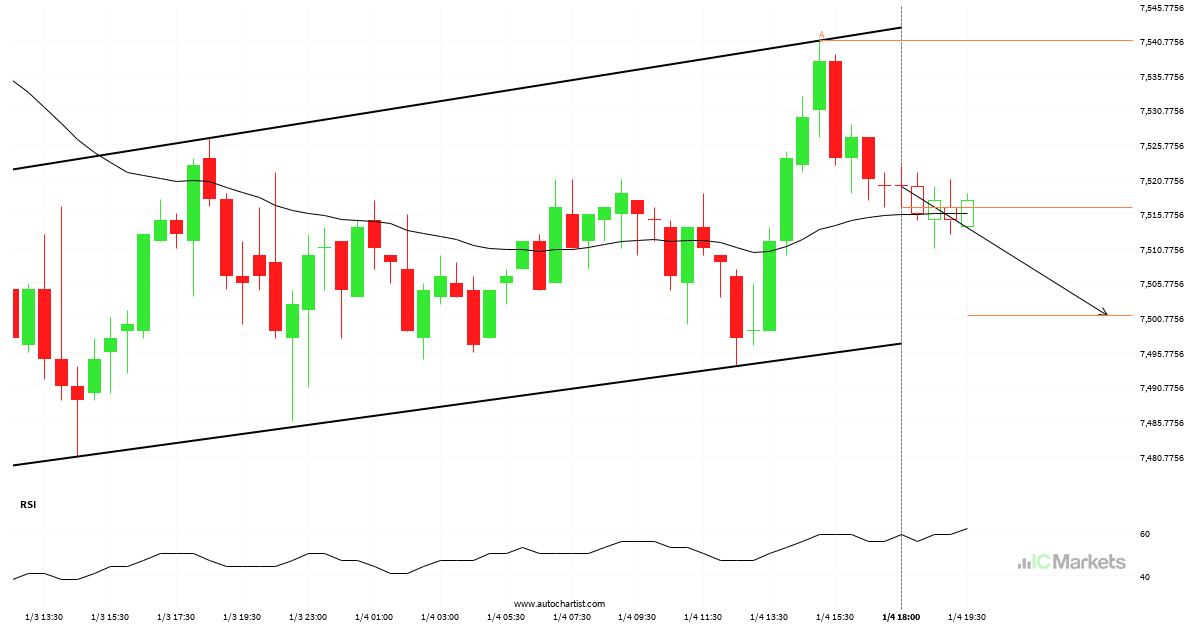
Either a rebound or a breakout imminent on Australia 200 Index
Australia 200 Index is heading towards the support line of a Channel Up and could reach this point within the next 6 hours. It has tested this line numerous times in the past, and this time could be no different from the past, ending in a rebound instead of a breakout. If the breakout doesn’t […]
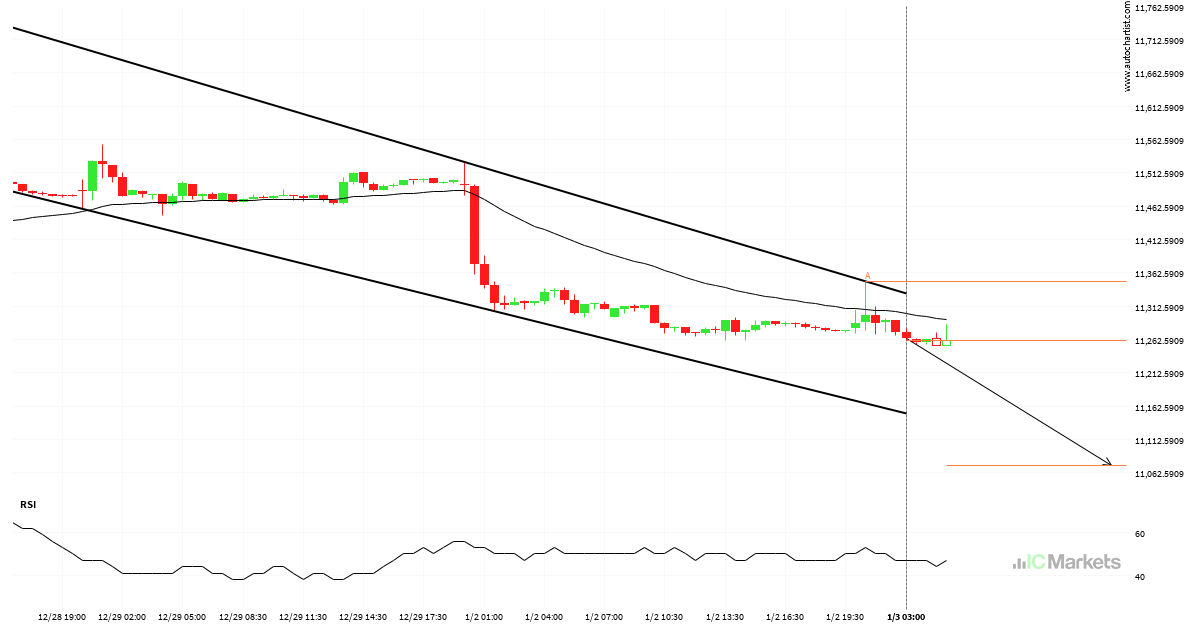
FTSE China A50 Index – getting close to support of a Channel Down
FTSE China A50 Index is heading towards the support line of a Channel Down. If this movement continues, the price of FTSE China A50 Index could test 11074.1400 within the next 11 hours. It has tested this line numerous times in the past, so this movement could be short-lived and end up rebounding just like […]